IN THIS ARTICLE
Script Canvas Debugging
Script Canvas supports live debugging of a Script Canvas graph running in game. You can use O3DE Editor or non-editor tools (such as game launchers) as debug targets.
To open the Script Canvas debugger and choose a target
From the Script Canvas Editor, choose Tools, Debugging. The debugger panel opens at the bottom of the Script Canvas Editor.

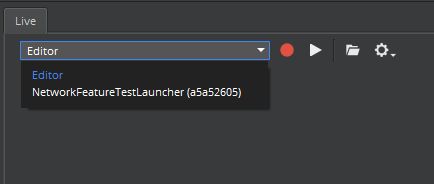
On the Live tab of the debugging panel, use the dropdown menu to choose the debug target. The default target is O3DE Editor, but you can use Script Canvas to debug the game running in standalone mode. For more information, see In-Game Debugging.
Choosing entities and graphs to debug
After you choose a debug target, you can choose the entities and graphs that you want to debug.
To choose entities and graphs to debug
To see entities with Script Canvas graphs that are available for debugging, expand the items on the Entities tab. The Entities tab displays the entities known to the debugger at edit time that have Script Canvas graphs.
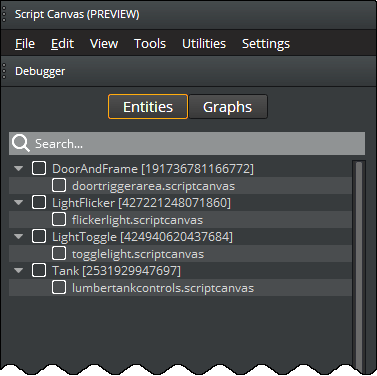 Note:Running the same graph multiple times on a single entity is not supported.
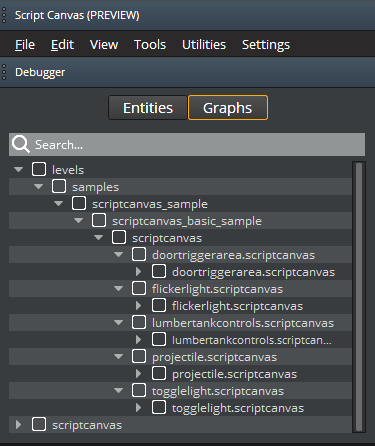
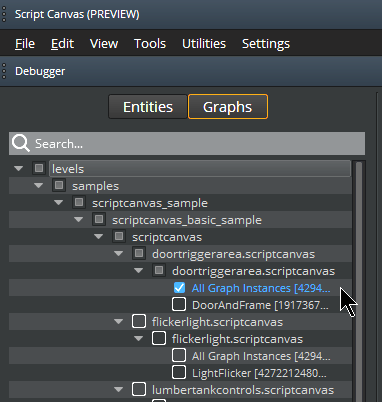
To get a complete listing of all available Script Canvas graphs in the project, choose the Graphs tab. Each graph in the table shows all entities that are using that graph. The Graphs tab is useful for debugging dynamically spawned scripts. For more information, see Debugging a Dynamically Spawned Graph later in this topic.
On the Entities tab or Graphs tab, select the check boxes for the entities or graphs that you want to debug.
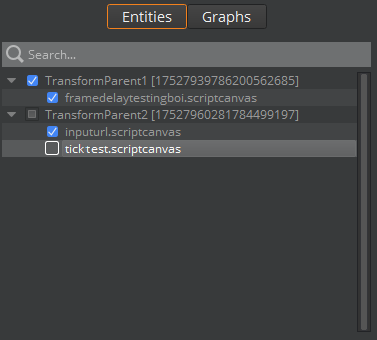
To capture all instances of a selected graph, select All Graph Instances.
Configuring debugger options
Use the following options to configure debugger behavior.
Auto Capture

Enable this option if you want the output from a specified target to be captured as soon as the debugger connects to it. For external tools, capture starts immediately when you enable this option. For O3DE Editor, capture starts when the editor enters game mode.
Live Updates

Enable this option to display the data as it is captured. When disabled, the data is captured silently and displays only after the capture completes.
Note:When live updates are enabled and you capture a large amount of data, editor performance decreases noticeably. For better performance, you should disable live updates, especially for longer captures.
Running the debugger
After you have chosen the entities or graphs to debug, you are ready to run the Script Canvas debugger.
To run the Script Canvas debugger
Choose Capture. The Capture button puts O3DE into gameplay mode automatically.
 Note:If Editor is selected as the capture target, the game must be running for the debugger to return results.
The Script Canvas debugger begins capturing data when the graph runs. If live updates are enabled, the data appears in the debugger panel when the graph being debugged becomes active during gameplay. Otherwise, the data appears after the capture completes.
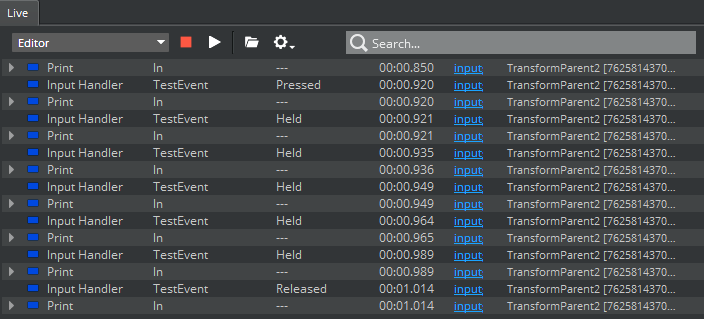
After you have enough data, choose Capture again to stop the data capture.
Examining captured data
The captured data is presented in a log that is sorted in order of processing. Each line represents the processing of a single node.
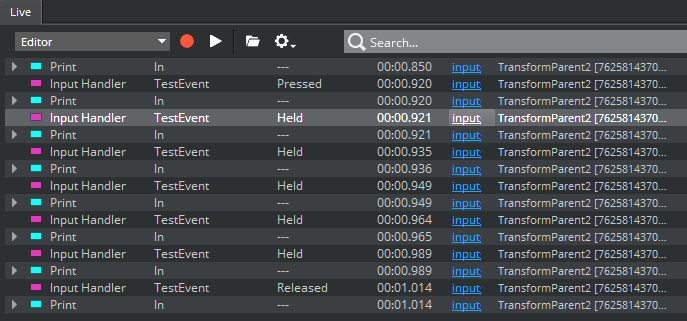
Note:Currently, only a single instance of captured data can be stored. Previous data is lost when a new set of data is captured.
To examine the captured data
To see the Script Canvas node that corresponds to a line in the log, choose the line.
Each line typically shows the node’s In signal and Out signal. If the In or Out signal is not present, the node is either the first or final node of a given line of logic. As shown in the following image, the Set Location Rotation node is the final node, so an Out signal is not present.
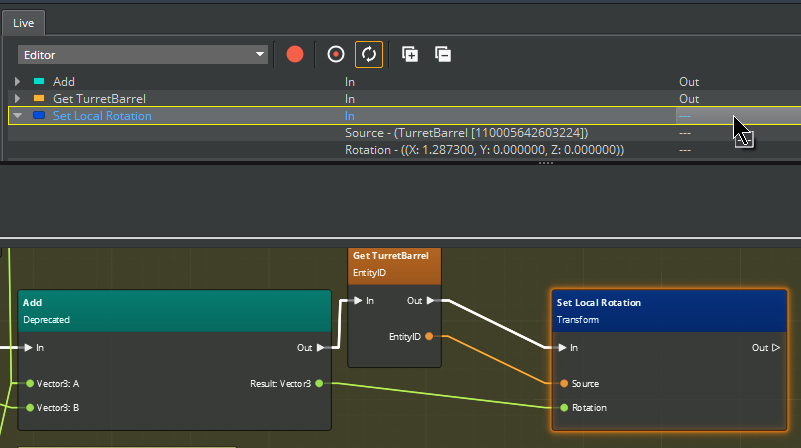
Use the up or down arrow keys to move through the log messages in the debugger panel. As you do so, the corresponding node to in Script Canvas graph is highlighted.
To examine the data that the node was using, expand the log message.
 Note:Some nodes send additional information that appears in the form of annotations. For example, the Print node sends the full string that it displayed.
To expand all lines, choose the
 expand icon.
To collapse all lines, choose the collapse
 icon.
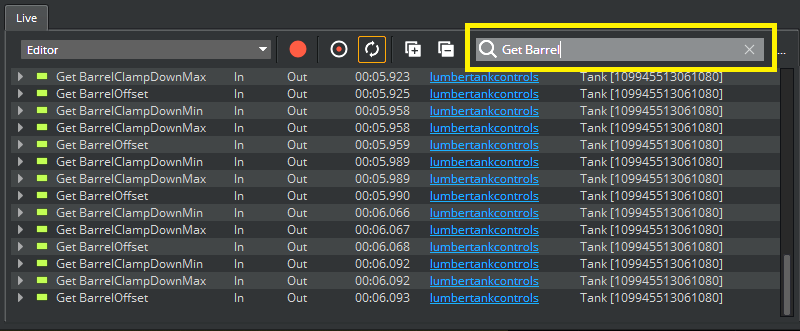
icon.To search for a particular node name or names, use the Search box.
Debugging a dynamically spawned graph
Dynamically spawned graphs are usually part of a spawnable object. Because dynamically-spawned graphs cannot be known at edit time, you must select them by name rather than by the entity or entities on which they are used.
To debug a dynamically spawned graph
On the Graphs tab, select the name of the graph.
Follow the same steps that you use to debug any other Script Canvas graph. The debugger records the graph’s operations when the graph becomes active during gameplay.
In-game debugging
For in-game debugging, you use the Script Canvas debugger to connect to a running game launcher.
To debug a running game
Run the launcher for your game.
On the Live tab of the Script Canvas debugger, choose the launcher from the list of debug targets. When you choose the launcher as the debug target, Script Canvas execution is recorded for the graphs that you specify.

Notes on debugging
When using the Script Canvas debugger, keep the following points in mind.
Performance
The editor experiences a severe decrease in performance when it is capturing data. To mitigate this, disable live updates and avoid capturing lengthy sessions. Lengthy sessions can easily lead to a sharp increase in logging events. If your game runs at 60fps and you have 40 Script Canvas nodes that run on each tick, 2400 log messages must be displayed every second. After a minute, this number increases to 144,000 messages. To minimize the amount of data captured, limit the scope and intensity of logging.
Saving issues
When you modify a graph and save it, some IDs are remapped in the asset, but not in the visualized Script Canvas scene. As a result, the unified ID used in the logging messages no long matches the visual presentation. This mismatch causes the visual scraping to fail. To work around this, close and re-open the Script Canvas scene.
